Visualization of research results plays an important role in
the perception and interpretation of the obtained data. Nowadays, image
analysis methods are quite popular. For example, in [1] the results of research
on the effectiveness of algorithms for object detection on low quality images
are presented. This issue is very important in the context of, for example, telemedicine,
for object detection on MRI images.
In the field of technosphere safety, researchers are currently
actively studying issues related to mathematical, numerical modeling and
analysis of natural climatic phenomena, such as, for example, snow avalanches
[2] or tornadoes [3].
Natural phenomena such as tropical cyclones pose a
considerable danger, which can cause not only irreparable damage to
infrastructure, but also lead to the death of the population. To study the
kinetics of vortex flows, O.V. Opryshko in his work investigates the model of
gas flow in the natural part of tornadoes and tropical cyclones [4].
The paper [5] considers the study of the interrelationship of
earthquakes and tropical cyclones. As a result of studying the dynamics of earthquakes
and tropical cyclones, characteristic time intervals were revealed, as a result
of which the probability of a powerful seismic shock becomes maximum when
cyclones become active again.
The relevance of the study of tropical cyclones for the territories
of the Russian Federation is confirmed by the work of N.A. Ozerova. [6], during
the study of the peculiarities of the evolution of tropical cyclones, which
have their influence on the weather of the Far East of the Russian Federation.
The system of tropical cyclone diagnostics based on satellite data, which is
being developed within the framework of the “Priority 2030” program, can serve
as another confirmation [7].
Prediction of vortex structures development in his work [8] is
studied by Levina G.V. Specific configurations of vortex clouds, corresponding
to the initial stage of cyclogenesis, found in the work, are proposed by the
author to be used in operational meteorological diagnostics when analyzing
satellite images of clouds.
For tracking and monitoring of tropical cyclones, a
methodology for reconstructing the intensity of tropical cyclones from their
satellite images has been developed [9].
All developments in the field of tropical cyclone research are
accompanied by the implementation of software packages with visualization of
processed data [10,11].
A review of models and methods for analyzing data represented
as a spatio-temporal process is considered in the paper. The study formulates
the problem of finding relationships between multi-parametric characteristics
with time and space as an argument [12].
This paper presents the possibility of visual assessment,
using the Python programming language software tools, of the results of almost
periodic analysis of photo and video data of tropical cyclone dynamics.
Almost period – values closest to periods. In general terms,
an almost periodic function f(t) is a function that satisfies the condition:
|f(t+τ)-f(t)|<Ɛ, where Ɛ>0 is the offset, τ is the almost period of the function f(t).
Almost periodic analysis is the analysis of data with an
ordered argument to identify dependencies that are close to periodic. The use
of almost periodic analysis allows the identification of critical turning
points in the trends of the data under study, regardless of a priori
assumptions.
Processing and subsequent analysis of images of tropical cyclone
structures consists of several steps. First, the original image is converted to
black-and-white format, to the default size of 500x500 pixels. The center of
the tropical cyclone from which the image is further transformed into polar
coordinates is determined. Slices of the obtained image along the polar angle
values are processed by the generalized shift function (1).
|
|
(1)
|
where
n is the total number of samples of the function y(t); t - positive and
negative integers, including zero; Δt - positive integer, argument shift;
τ - positive integer, values of almost periods.
The local minima of the obtained function are analyzed at
different environments of the argument Δt and the
most significant and coinciding ones are selected, being almost periods for the
vector of values under study. The results of processing the generalized shear
functions for all slices of the image are summarized and the most occurring
values of almost periods that characterize the studied state of the tropical
cyclone structure in the image are selected. The identified near-periods are
displayed in the image by multiple circles from the identified center of the
tropical cyclone, highlighting the characteristic zones of the tropical cyclone
structure in the image. This analysis and visualization approach has been
demonstrated in [13-15].
The key feature of this study is to supplement the
visualization of tropical cyclone boundary zones based on the identified
near-periods by marking rings according to the type of hazard representation.
When processing the photo and video sequences of the largest
tropical cyclones for the last years, the following estimates of the hazardous
zones of the tropical cyclone structure depending on their assumed categories
on the Saffir-Simpson scale were obtained.
The stages of development of tropical cyclones of the first
and second categories showed the presence of common features, due to which the
structural division of the cyclone into the following ranges was obtained.
Particularly dangerous zones of a tropical cyclone are located from the
hurricane center to the marked circle with a tripled or quadrupled radius,
which is based on the found characteristic almost period. Danger zones are
located beyond the tripled or quadrupled radius circles to circles with radii
that are multiples of the tripled or quadrupled near-period, and areas beyond
these circles are considered high watch areas.
Tropical cyclones located at the stage of development of the
fourth and fifth categories have similar visual signs. Here, especially
dangerous zones of a tropical cyclone are located from the center of the
hurricane to the marked circle with a radius of about 110 pixels. The danger
zones are located up to circles of double or triple the radius equal to the
identified near period. Areas beyond these circles are considered to be high
watch areas.
Tropical cyclones of the third category of danger on the
Saf-fir-Simpson hurricane scale can have similar structural features of
development as cyclones of the second category and cyclones of the fourth
category. Because of this, no clear assessment criterion was formulated for
them, and when processing the frames of a cyclone that is at a given stage of
development, the parameters are manually adjusted depending on the structure
under study.
To solve the problem of displaying only the zones with radii
that are multiples of the revealed almost periods, the plot module of the
matplotlib library of the Python programming language worked perfectly. The
image data in black-and-white format is a matrix of pixels that take values
from 0 to 255, which allows you to display it using the contourf module,
designed to display the contour representation of data.
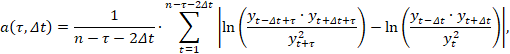
An example of visualization is shown in Fig. 1. In the
resulting visualization, we can see how circles are drawn from the marked
center from the center of the “eye of the storm”, with radii that are multiples
of the period of 81 pixels.
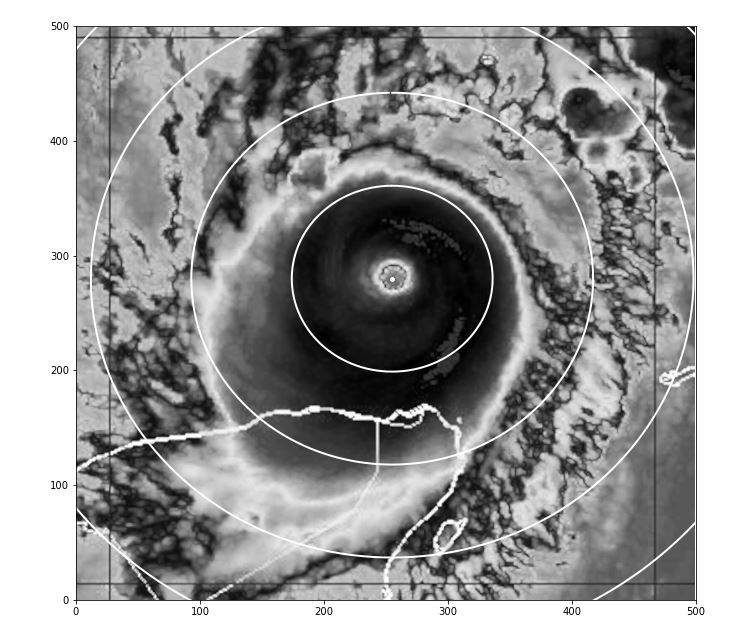
Fig. 1. Tropical
cyclone Milton, state as of 21:35 UTC 8.10.24, with labeled structural circles,
multiples of almost period 81 pixels
In the course of the task of marking the formed rings by
hazard zones, a problem arose about the possibility of hatching on the graphical
plane with the capabilities of the used visualization tools. The solution to
this problem was an additional visualization section of the matplotlib.patches
library.
This section provides a set of visualization modules that
allow you to define arbitrary two-dimensional regions on the graph. In this
section, two program modules were used to solve the task at hand. The first one
is Circle, which displays on the plane a circle with specified coordinates of
the center and radius values. This module was used to display and further hatch
the area of the circle with radius equal to almost period.
The second module used was Wedge. It is often used to display
wedge-shaped shapes with a given center and radius, covering the given
boundaries at the corners of the mark. This module has a width parameter that
allows you to draw a partial wedge from the inner to the outer specified
radius.
To build the necessary visualization, the Circle module was
fed with the values of the tropical cyclone center point on the image, and the
Wedge module was configured as follows. As input parameters, the module also
accepted the coordinates of the tropical cyclone center, the radius, the size
of which was equal to the corresponding value, a multiple of the detected
near-period. The boundaries of the structure markup angles were set from 0 to
360 degrees to reflect the ring. And the value of the almost period was
specified as the width parameter.
To fill the danger zones with hatching, an additional
parameter hatch was supplied to the Circle and Wedge modules, which sets the
type of hatching to be displayed. A slanted hatch (“/”) was selected to
indicate a high hazard zone, a dot or polka-dot hatch (“.”) was selected to
indicate a hazard zone, and a grid hatch (“#”) was selected to indicate a
high-surveillance zone.
For an image of a tropical cyclone that is, for example, in
the fifth stage of development and with a detected near-period of 81 pixels,
the result of the visualization of the danger zones would be the image from
Fig. 2

Fig. 2. Structural
tropical cyclone hazard zones for a near period of 81 pixels and tropical
cyclone hazard category five on the Saffir-Simpson Hurricane Scale
Since in the developed classification of hazardous zones of
tropical cyclone structure in the image depending on the detected near-periods
the boundaries of hazardous zones can change depending on the tropical cyclone
under study and the vagueness of determining its hazard level according to the
Saffir-Simpson hurricane scale, the functionality of additional parameter
customization is provided.
As an example, to cover the capabilities of the program, let
us consider a case with a smaller period and if the third category of a tropical
cyclone is set, which by its characteristics can belong both to the zone of
assessments of the first and second categories and to the zone of assessments
of the fourth and fifth categories (Fig. 3).
If we change the parameters in such a way that the lower
boundaries of the danger zones are maximum and the upper boundary of the danger
zone is minimum, then the obtained result is presented in Fig. 4.
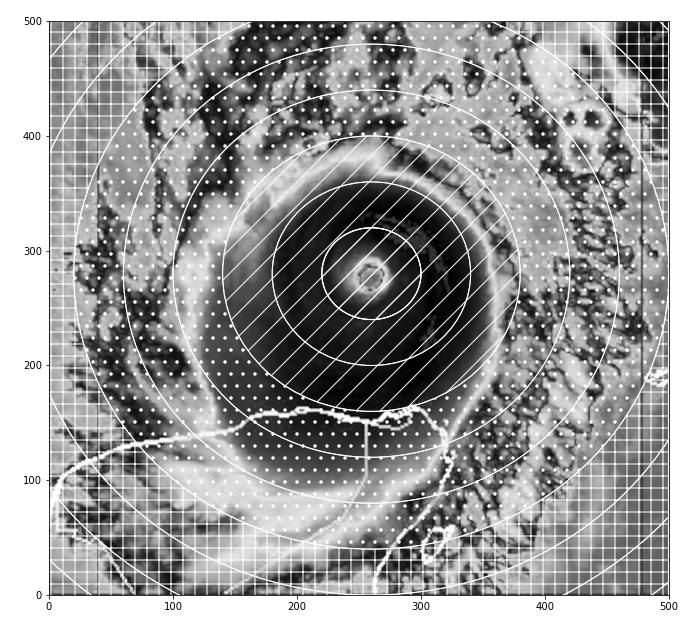
Fig. 3. Structural
tropical cyclone hazard zones for a near period of 40 pixels and tropical
cyclone hazard category three on the Saffir-Simpson hurricane scale
It should be noted that varying the parameters may result in
identical cases of zone marking.
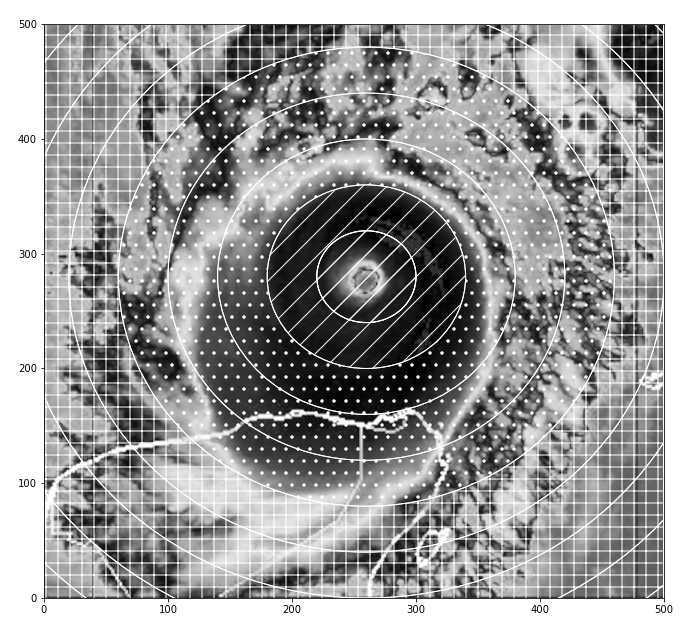
Fig. 4. Structural zones with modified settings along tropical cyclone zone boundaries
Thus, if we change the estimation of the third category and
estimate the obtained parameters of the tropical cyclone as a tropical cyclone
of level 4, the result coincides with the data from Fig. 4.
The general functionality of the image processing and analysis
program is shown in Fig. 5.
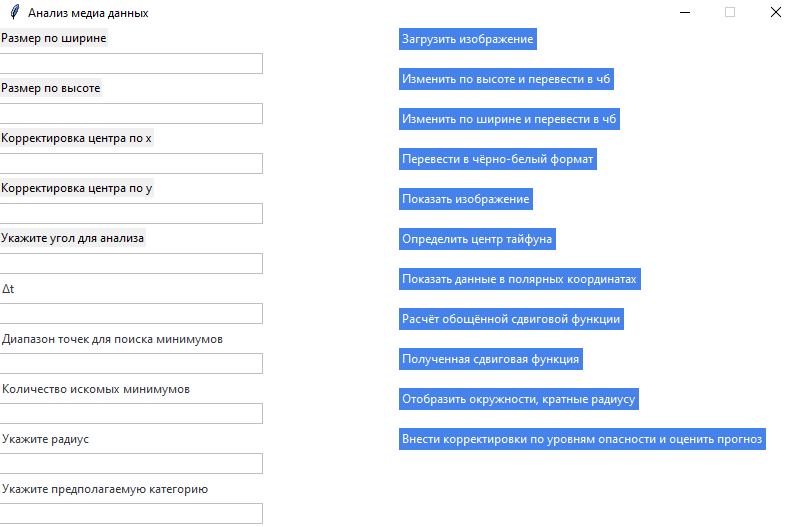
Fig. 5. Image processing tool window
The program's functionality allows you to load images for
processing and analysis from your local computer environment and resize images
as needed. For convenience of processing and further analysis, images can be
converted to black and white format at the click of a button, and the results
of all conversions performed by the program can be displayed on the screen for
viewing.
The center of the cyclone is determined automatically; if
necessary, manual adjustment is provided to correct the determined center.
To identify quasi-periodic structures, the image is converted
to polar coordinates, and for each polar angle value, function (1) is
calculated for the radius vector values. Analysis of the cross-sections reveals
characteristic quasi-periodic values of the radius vectors.
After performing quasi-periodic analysis for images, multiple
radii are constructed based on the found quasi-periodic values and marked
according to the described hazard criteria.
To deploy and use the program, it is sufficient to have a
computer with the Windows operating system and the Python 3.9 or higher
programming language installed. The program has not been tested on other
operating systems.
The following key software packages and libraries were used to
develop the program with the corresponding capabilities. The Tkinter package
for creating a graphical user interface, the pandas library for using
mathematical tools necessary for data processing and analysis. The
comprehensive Matplotlib library for graphical visualizations, as well as the
multiprocessing package to speed up data processing using a process
parallelization mechanism.
As a result of this study, a visual assessment of the danger
of tropical cyclone structure zones based on almost periodic analysis is
proposed.
The visualization toolkit is considered, which allows setting
up and displaying both the tropical cyclone zones, the radii of which are
multiples of the found characteristic almost periods, and the shading of the
inter-zonal space taking into account the degree of danger relative to the
cyclone center.
The developed software implementation of the proposed
visualization method is planned to be submitted for state registration of
programs.
This development can be useful for emergency services as an
operational diagnostic tool to support decision-making in emergency situations
caused by natural hazards.
1. Provorova A. A. Polyakova I. Yu. V. Comparison of the effectiveness of different approaches in the task of object detection on a low-quality image // Scientific Visuali-zation. - 2024. - Т. 16, № 3. - С. 1-13. - DOI 10.26583/sv.16.3.01.
2. Lentyaeva, T. V. Program realization of the three-dimensional model of the snow mass dynamics // Vestnik of the Voronezh Institute of FSIN of Russia. - 2023. - № 3. - С. 104-111.
3. Chirkunov, Yu. A. Pikmullina, E. O. Mathematical modeling of the snow mass dynamics. O. Mathematical modeling of gas particle motion inside a tornado // Vest-nik of Voronezh State University. Series: Physics. Mathematics. - 2023. - № 3. - С. 18-31.
4. Opryshko, O. V. Numerical Simulation of Nea-Bottom Parts Of A Tornado And A Tropical Cyclone In A Stationary Case // Journal of Computational and Engineering Mathematics. - 2023. - Vol. 10, No. 1. - P. 30-43. - DOI 10.14529/jcem230104.
5. Golovachev S. P., Dubrov M. N., Vol-kov V. A., Alexandrov D. V., Eremin I. S., Kalenov D. S. Investigation of Atmosphere-Ocean Interactions. S. S., Kalenov D. S. In-vestigation of the atmosphere-ocean-lithosphere interrelations on the example of in-teraction of intense tropical cyclones and the strongest earthquakes // Modern Prob-lems of Remote Sensing of the Earth from Space. - 2024. - Т. 21, № 4. - С. 99-111. - DOI 10.21046/2070-7401-2024-21-4-99-111.
6. Ozerova N. A. Study of the peculiarities of the evolution of tropical cyclones af-fecting the weather of the Russian Far East // European Journal of Natural History. - 2023. - № 1. - С. 29-34.
7. Priority 2030. System of diagnostics of tropical cyclones. [Electronic resource]. URL: https://2030.dvfu.ru/sistema-diagnostiki-tropicheskih-cziklonov/ (circulation date 26.01.2025).
8. Levina G. V. Application of the theory of turbulent vortex dynamo for early di-agnostics of tropical cyclones nucleation // Fundamental and Applied Hydrophysics. - 2022. - Т. 15, № 2. - С. 47-59. - DOI 10.48612/fpg/vaxg-xdmv-11pn
9. Yakusheva, A. N. Ermakov, D. M. Development of a New Automatic Methodol-ogy for Tropical Cyclone Intensity Recovery from Multispectral Satellite Earth Obser-vations Data Using Artificial Neural Networks // Modern Problems of Earth Remote Sensing from Space. - 2024. - Т. 21, № 2. - С. 336-349. - DOI 10.21046/2070-7401-2024-21-2-336-349.
10. Vareljyan G. G., Naryshkina Y. N., Dorfman K. V., Alekseev E. V. Automated in-formation system “Web. V. Automated information system “WebGis Avia 1” // Certif-icate of state registration of computer program No. 2022617909 Russian Federation: № 2022616354.
11. Krivonosov M. I., Vershinina O. S., Pirova A. Yu., Kanakov O. I. Pro-software complex for construction of correlation climatic networks and assessment of the as-sociation of network metrics with the position of tropical cyclones // Certificate of state registration of the computer program No. 2022682718 Russian Federation.
12. Krynetsky, B. A. Analysis of models of periodic structures of space-time pro-cesses // Actual problems of applied mathematics, computer science and mechanics : proceedings of the International Scientific Conference, Voronezh, December 04-06, 2023. - Voronezh: Limited Liability Company “Valborn”, Publishing House “Research Publications”, 2024. - С. 497-501.
13. Paramonov A. A., Kalach A. V. On the Possibilities of Application of the Near-Periodic Analysis Method for Image Processing // Modeling of Systems and Process-es. - 2024 - Т. 17, № 3. - С. 44-52. DOI: https://doi.org/10.12737/2219-0767-2024-42-50.
14. Paramonov A. A. Detection of almost-periodic characteristics of satellite-images of typhoons in the aspect of solving problems of technosphere safety // Tech-nosphere safety. - 2024. - Т. 44, № 3. - С. 71-76.
15. Paramonov, A. A. A.; Kalach, A. V. Modeling of emergency situations using al-most-periodic analysis of images of the structure of tai-funs // Bulletin of the South Ural State University. Series: Mathematics. Mechanics. Physics. - 2024. - Т. 16, № 4. - С. 67-74. - DOI 10.14529/mmph240408.